Is Efficiency Even REAL
bothers me about motor specifications: manufacturers love to advertise peak efficiency numbers that sound incredible, 95%, 97%, or even higher. But here's what most people miss: being efficient at 400V and 400A is great, but if your motor spends most of its time well below the 400A level, does that efficiency number really mean anything?
The answer is more complicated than you might think, and it shows a functional difference between how we should evaluate motors for battery-operated vehicles versus stationary equipment.
The Peak Efficiency Trap
Let me give you an example. You're shopping for an electric motor, and the spec sheet says "96% efficiency." Sounds impressive, right? But look closer and you'll find that amazing number only applies at one specific condition, which is normally around 75-80% of the motor's maximum power. It's like advertising a car's fuel economy based only on cruising at exactly 55 mph on a flat highway. Technically true, but not very useful for real-world driving.
This problem gets worse for battery electric vehicles. Unlike industrial motors that might run a conveyor belt at the same speed for hours, EV motors face constantly changing demands. You're accelerating from stoplights, cruising on highways, crawling through parking lots, and recovering energy when braking. Your motor is working across its entire range, and it's rarely hitting that perfect spot where the efficiency chart shows those impressive high-90s percentages.
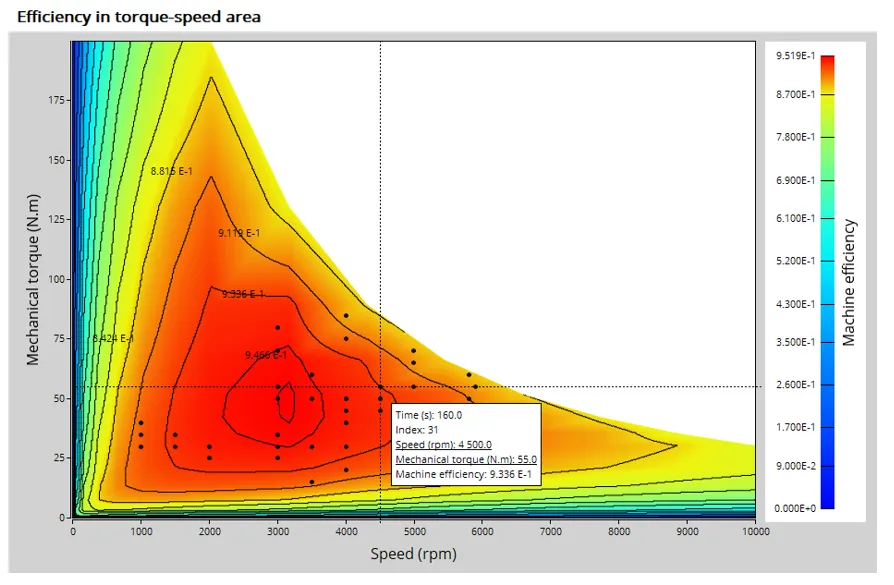
Understanding Efficiency Maps and Operating Points
Modern motor design uses efficiency maps, which are basically charts that show how efficient a motor is at every combination of speed and torque. These maps reveal something important: efficiency drops at the extremes. At very low power (like cruising on flat ground), you might be down in the 80s or even lower. At very high power (hard acceleration), efficiency drops again.
Here's the key insight: a motor's "real" efficiency for battery vehicles isn't its peak number, it's the average efficiency across how it's used in the “real world”. If your motor hits 96% efficiency at one operating point but you only drive there 5% of the time, that number doesn't mean much.
What Makes Battery Vehicles Different from Stationary Equipment
This is where the fundamental difference shows up. Industrial motors typically operate in predictable patterns. A pump motor might run at 75% power for hours. A fan might operate continuously at the same speed. These applications can be designed around their specific operating point, and that peak efficiency number really matters.
Battery electric vehicles are completely different. Research shows that EVs operate across highly variable patterns with constantly changing power demands. Studies of real-world driving have found that the average operating efficiency of an EV motor can be much lower than its peak efficiency simply because the motor rarely operates at its best point.
Here's what really matters for battery vehicles:
Efficiency at partial power is critical. Industrial motors might work efficiently at 50-100% of their rated power, with peak efficiency around 75%. But EVs frequently operate at 10-30% of their motor's capability during normal driving. If your motor's efficiency drops significantly below 50% power, you're wasting a lot of energy.
A wide efficiency range beats a narrow peak. You want a motor that maintains 90%+ efficiency across a broad range of operating conditions, even if its absolute peak is slightly lower than a competitor. A motor with 94% efficiency from 25-100% power will outperform one with 97% peak efficiency but only 85% at light loads.
Where you actually operate determines real performance. Analysis of driving patterns reveals where your motor spends most of its time. For typical city driving, you might spend 60% of your time at low power, 30% at moderate power, and only 10% at high power. Your efficiency at those low-power operating points determines your actual energy consumption.
The Metrics That Actually Matter
So how do you determine when a motor is "more efficient for battery operated vehicles vs stationary loads"? Here are the measurements that cut through the marketing hype:
Drive Cycle Weighted Efficiency is the best metric. This calculates efficiency as an average based on the actual percentage of time spent at each operating point during real-world driving cycles. A motor designed for EVs might show 91% drive cycle weighted efficiency versus a competitor with 96% peak but only 87% weighted efficiency.
Partial-Load Efficiency Curves reveal the truth. Look for efficiency data at 25%, 50%, and 75% power, not just maximum power. Industrial motors can drop to 60-70% efficiency at 25% power, which would be terrible for an EV that operates there frequently.
Efficiency Map Coverage shows how broad the high-efficiency zone is. What percentage of the motor's operating range maintains over 90% efficiency? A motor with 40% of its range in the high-efficiency zone will outperform one with just 10% coverage, even if the second one has a slightly higher peak.
Average Operating Efficiency is exactly what it sounds like. If you look at where you actually drive and compare it to the motor's efficiency map, what's the average efficiency across all those points? This is your real-world number.
Constant vs Variable Power: Why It Matters
Industrial applications typically involve either constant power loads (conveyors, extruders) or variable power loads that follow predictable patterns. These loads allow motor designers to optimize around specific operating conditions.
Electric vehicles are more complex, with highly variable power loads with unpredictable patterns driven by driver behavior, road conditions, and traffic. This requires fundamentally different motor design priorities:
Broader efficiency range, rather than a single perfect peak
Lower energy losses, at partial power, since you spend so much time there
Better heat management, for changing loads rather than constant operation
Control strategies, tuned for varying conditions and efficiency across the operating range
The Bottom Line: Real Efficiency for Real Driving
Here's my direct take: if someone shows you a motor efficiency specification without telling you the operating condition and usage pattern, that number is essentially meaningless. For battery electric vehicles, what matters isn't the best-case scenario, it's the average across thousands of varying operating points throughout actual driving.
The most meaningful question isn't "What's your peak efficiency?" It's "What's your average efficiency during a standard driving cycle?" or "What's your weighted efficiency across my specific usage pattern?"
This is why modern EV development relies heavily on efficiency mapping with usage pattern analysis. Engineers look at real-world driving patterns, compare them to motor efficiency maps, and calculate the true energy consumption. A motor that looks average on paper might outperform a "more efficient" competitor simply because its efficiency curve better matches where the vehicle operates.
For stationary equipment with well-defined, constant operating points, peak efficiency at rated power is a perfectly valid measurement. But for battery vehicles that spend their lives operating across a wide range of conditions? Give me drive cycle weighted efficiency or don't bother quoting numbers at all.
That's the measurement you need: drive cycle weighted efficiency or average operating efficiency calculated across the actual usage pattern. Everything else is just marketing talking about that one perfect moment that rarely happens in real life.
And as always YMMV, JC
NOTE: this article produced with the assistance of AI and Grammarly.